Nonintrusive Appliance Load Monitoring
Contents:
- Technical Overview
- Multistate Appliances
- Development Status
- People to Contact
- References and Related Links
This page is was created by George Hart
many years ago, and is now quite out of date. I am no longer
doing research in this area and can provide no more recent
information, but here are links to two recent conferences, which
should lead you to current information:
http://nilmworkshop.org/
http://www.ices.cmu.edu/psii/nilm/
Addendum, 2020: For recent
developments in this area, please contact Stephen Makonin at
Simon Frasier University (smakonin@sfu.ca)
Technical Overview
A Nonintrusive Appliance Load Monitor (NALM) is designed to monitor
an electrical circuit that contains a number of devices (appliances)
which switch on and off independently. By a sophisticated analysis
of the current and voltage waveforms of the total load, the NALM
estimates the number and nature of the individual loads, their
individual energy consumption, and other relevant statistics such as
time-of-day variations. No access to the individual components is
necessary for installing sensors or making measurements. This can
provide a very convenient and effective method of gathering load
data compared to traditional means of placing sensors on each of the
individual components of the load. The resulting end-use load data
is extremely valuable to consumers, energy auditors, utilities,
public policy makers, and appliance manufacturers, for a broad range
of purposes. For example, a monitor placed outside a home can
determine how much energy goes into each of the major appliances
within the home.
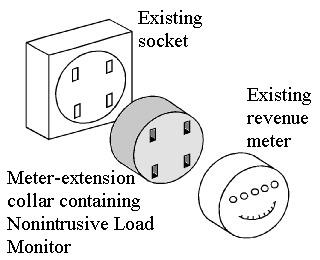
In a utility application, a NALM connects with the total load
using the standard revenue meter socket interface, as shown in the
figure above. This permits very easy installation, removal, and
maintenance compared with traditional intrusive load monitoring
techniques that require ``submetering'' and interior wiring. The
NALM monitors the total load, checking for certain ``signatures"
which provide information about the activity of the appliances
which constitute the load. For example, if the residence contains
a refrigerator which consumes 250 W and 200 VAR, then a step
increase of that characteristic size indicates that the
refrigerator turned on, and a decrease of that size indicates the
turn-off events. Other appliances have other characteristic
signatures. After determining the exact on and off times from the
signature events, any desired statistics, such as energy
consumption vs. time of day or temperature, can be tabulated.
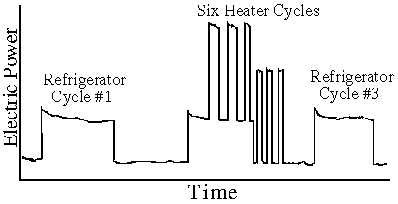
To appreciate how this works, consider this figure, which plots
total (real) power consumption vs. time for a single-family home
over a two-hour period. During this interval, the total load shows
activity due to a refrigerator and a heater. Two different-sized
step changes are clearly present, providing characteristic
signatures of the refrigerator and the heater. The refrigerator
cycles on and off three times, the heater six times. By measuring
the total load ouside the home, it is not difficult to find these
step changes and measure their size. Knowing the time of each on
and off event, the total energy consumption of the refrigerator
and the heater are easily determined. By also considering
measurements of the total reactive power or harmonic current,
along with the real power shown, changes in the resulting vector
function of time would reveal even more information about the
particular appliances.
Traditional load research instrumentation involves complex
data-gathering hardware but simple software. A monitoring point at
each appliance of interest and wires (or sometimes power-line
carrier techniques) connecting each to a central data-gathering
location provide separate data paths, so the software merely has
to tabulate the data arriving over these separate hardware
channels. The NALM approach reverses this balance, with simple
hardware but complex software for signal processing and analysis.
Only a single point in the circuit is instrumented, but
mathematical algorithms must separate the measured load into
separate components. In many load-monitoring applications, this is
a very cost-effective tradeoff, which is a major advantage of the
NALM.
In order to accurately decompose the aggregate load into its
components, a model-based approach for describing individual
appliances and their combination is used. These models suggest
certain signatures which can be detected in the total load to
indicate the activities of the separate components. This leads
naturally to practical architectures and algorithms for the NALM.
For full details, see the references below.
We have implemented these ideas and carried out a number of
initial field tests on residential loads to compare the NALM to
traditional load monitoring techniques employed by electric
utilities. Based on these tests, a commercial version of the NALM
is being developed for widespread utility use.
Multistate Appliances
My recent research has focused on appliances which can be understood
as multistate devices, using finite-state machine (FSM) models.
There are three classes of appliance models from the NALM
perspective:
- ON/OFF (Two-state)
- Appliances such as light bulbs or toasters, which are either
on or off at any given moment. Early research focused on
techniques for monitoring these.
- Multistate
- Appliances such as washing machines or dishwashers, with
distinct types of ON states, e.g., fill, rinse, spin, pump, etc.
Recent research has extended the methods to apply to the
multi-state case.
- Continuously variable
- Appliances like light dimmers and variable-speed hand tools,
with a continuous range of ON states. These are difficult to
monitor nonintrusively, because they do not generate step
changes in power.
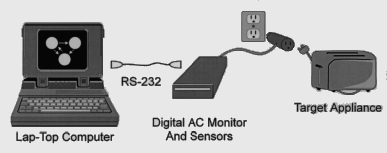
To learn the FSM control structure of different multistate
appliances, we have developed the portable instrumentation
illustrated here. This is a new tool, which analyzes the behavior
of an operating electrical load in a novel manner by automatically
describing it with a finite-state model of its control structure.
A personal-computer-based system collects samples of real and
reactive power consumption over time, and automatically learns the
control structure of the load in real time, drawing its
finite-state diagram. The system also reports the load's state at
each point in time, the total time spent in each state, and total
energy consumption for each of the states.
One use of this tool is to provide a database of common appliance
FSM structures for the NALM project. This research also has
applications to behavioral analysis, energy monitoring, fault
monitoring, fault analysis, and power quality analysis of many
types of electrical loads, controllers, and power sources.
Although only tested on residential loads and consumer appliances
so far, the underlying methods should also work on commercial and
industrial loads, e.g., HVAC control systems.
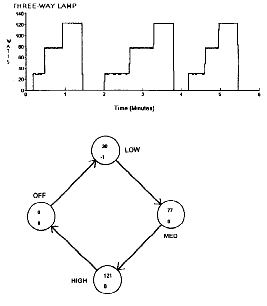
Three-way Lamp
As an example, if a three-way lamp is operated, a plot of power
versus time shows plateaus at the low, medium, and high power
levels. The patern-recognition algorithm in the instrument detects
these, and constructs the FSM disaram shown, illustrating how the
four states are cyclically connected.
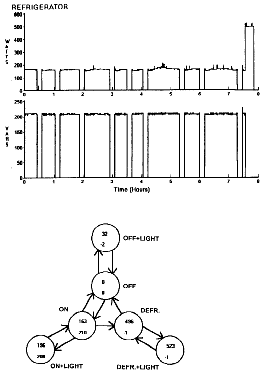
Frost-free Refrigerator with Interior Lamp
A more complex example is this frost-free refrigerator. From the
measured plots of real and reactive power, the six-state FSM shown
is generated. The inner three states correspond to the light being
off (the door closed) and the outer three occur when the light is
on. The power plot shows how on/off cycles of the compressor are
followed by a single defrost cycle in which the motor is off but a
heater is on (so there is a large real power, but no reactive
power). The FSM generated captures all this behavior
For details of the algorithm, discussion, and many more examples,
see my paper ``Automatic Construction of Finite-State Load
Behavior Models," listed in the references
below.
NALM Development Status
The Electric Power Research
Institute (EPRI) has sponsored NALM research since its
conception in the early 1980's. EPRI has chosen Telog Instruments to
commercialize the NALM into a research tool available to electric
utilities. A beta-test program of the commercial version of the NALM
is underway, and units are expected to be available to electric
utilities in 1997. For exact availability information, contact: TelogSales@telog.com
 Telog Instruments, Inc.
830 Canning Parkway
Victor, NY 14564-8940
(716) 742-3000
People to Contact
A number of people at a number of organizations are involved in
research and development of NALM techniques.
- George W. Hart
- Originator and developer of the NALM. Originally at MIT, then
at Columbia University, I was briefly at Hofstra University.
Contact information and additional information regarding my
research is available on my home page.
- Lawrence Carmichael
- Mr. Carmichael is the project supervisor at the Electric Power Research Institute
(EPRI) in charge of the NALM. (415) 855-7982
- Mark Malmendier
- Mr. Malmendier is the product manager of Telog Instruments,
Inc. in Rochester, New York. (716) 742-3000, email: TelogSales@telog.com
- Leslie Norford and Steven Leeb
- Profs. Norford and Leeb are engaged in research at MIT to explore the
possibilities of extending NALM techniques to transient
information in commercial buildings.
- Jackie Lemmerhirt and Ralph Abbott
- Plexus Research (in Acton, Massachusettes) is involved in
coordinating the electric utility community to the NALM
development efforts. Ms. Lemmerhirt (jlemmerhirt@plxs.com)
is carrying out a project comparing NALM output with independent
instrumentation in a number of test houses. This should provide
solid data on the accuracy of the NALM. Mr. Abbott is president
of Plexus.
References
A good introductory tutorial survey is the following article. (The
above technical overview is excerpted from it.)
- Hart, G.W., ``Nonintrusive Appliance Load Monitoring," Proceedings
of the IEEE, December 1992, pp. 1870-1891.
Two earlier technical reports are now available as PDFs:
- Hart, G.W., Prototype Nonintrusive Appliance Load Monitor,
MIT Energy Laboratory Technical Report, and Electric Power
Research Institute Technical Report, September 1985, online copy.
- Hart, G.W., Nonintrusive Appliance Load Data Acquisition
Method, MIT Energy Laboratory Technical Report, and
Electric Power Research Institute Technical Report, September
1984, online copy.
A bibliography of early published papers
concerning nonintrusive load monitoring is also available.


 Telog Instruments, Inc.